Mitt Romney’s Impressive Word Gymnastics

In the past 48 hours, we’ve seen some truly epic logical contortions from Mitt Romney’s Republican presidential campaign.

Yesterday, hoping to slow his public opinion nosedive two weeks ahead of the Michigan primary, Mr. Romney attempted to defend his infamous 2008 “Let Detroit Go Bankrupt” editorial with a second editorial in the Detroit News.

Mitt Romney's Contortions

In his new valentine to Michigan and the auto industry, Mr. Romney somehow managed to simultaneously take credit for and attack President Obama’s successful 2009 bailout of the industry.  Witness (my emphasis):

Ultimately, that is what happened. The course I recommended was eventually followed. GM entered managed bankruptcy in June 2009 and exited it a month later in July.

Then, two short paragraphs later:

By the spring of 2009, instead of the free market doing what it does best, we got a major taste of crony capitalism, Obama-style.

“They did what I told them to do, and it was a disaster.”

Not only was yesterday’s editorial internally inconsistent, it was also inconsistent with Mr. Romney’s 2008 editorial, which actually called for increased goverment involvement and investment, rather than simply leaving the “free market” to its own devices.

On Monday, Mr. Romney pre-empted President Obama’s 2013 budget release in an e-mail to reporters (my emphasis):

This week, President Obama will release a budget that won’t take any meaningful steps toward solving our entitlement crisis.

The president has failed to offer a single serious idea to save Social Security and is the only president in modern history to cut Medicare benefits for seniors.

I believe we can save Social Security and Medicare with a few common-sense reforms, and – unlike President Obama – I’m not afraid to put them on the table.

Mr Romney starts by attacking Mr. Obama for not addressing entitlement spending.

Then he attacked Mr. Obama again for addressing entitlement spending.

Then he attacked Mr. Obama a third time for not addressing entitlement spending.

And Mr. Romney accomplishes this amazing flip-flop-flip in three successive sentences.

And to make Mr. Romney’s linguistic artpiece even more mind-blowing: all three assertions are demonstrably false.  Mr. Romney is lying.

First, President Obama’s 2013 budget proposes cutting $360 billion in Medicare and Medicaid spending over 10 years.

Second, the Affordable Care Act did not cut benefits for seniors. It created provider-side efficiencies which reduced future Medicare spending to the tune of $500 billion.

Finally, Mr. Obama proved all-too-willing to put entitlement reforms “on the table” during last year’s debt ceiling negotiations.  (It is worth noting that Republicans walked away from the difficult discussions, not Obama.)

Mr. Romney was already renowned for his serial flip-flopping.

It seems that Mr. Romney has now taken his fact-free postmodern candidacy to a new plateau with his most recent linguistic art project.

His new statements don’t just thoroughly contradict previous ones; Indeed, Mr. Romney’s most recent statements thoroughly contradict themselves.

The Austerity Drag

The U.S. economy added 243,000 jobs in January, far surpassing analysts’ expectations of around 155,000 jobs for the month.  As a result, the unemployment rate also unexpectedly ticked down to 8.3 percent for January.

The private sector added 257,000 jobs in January, while public-sector employment dipped another 14,000.

And that last part is important, because it begins to reveal the truly destructive nature of austerity.

Amid the wrong-headed drive to shrink the size of federal, state, and local governments (government employees make up one-sixth of the workforce), private sector job gains have been partially thwarted by the losses of government jobs.

With the release of the jobs data each month, the ever-insightful Steve Benen – who joined The Maddow Blog this week – republishes his two charts showing job losses and gains for each month since the beginning of the Great Recession.

The first chart shows the overall jobs picture, while the second shows the jobs picture for the private sector alone.  My shameless rip-off adaptation of these charts is below. As with Steve’s charts, the red columns show monthly job losses under George W. Bush, while the blue columns show monthly job totals under Barack Obama:

JobsJanuary2012Total

The second chart shows that the private sector has been adding jobs for each of the past 23 months.

JobsJanuary2012Private

Also worth noting: there are more total private-sector jobs today (110.4 million) than in February 2009 (110.3 million), just days after Barack Obama took office.

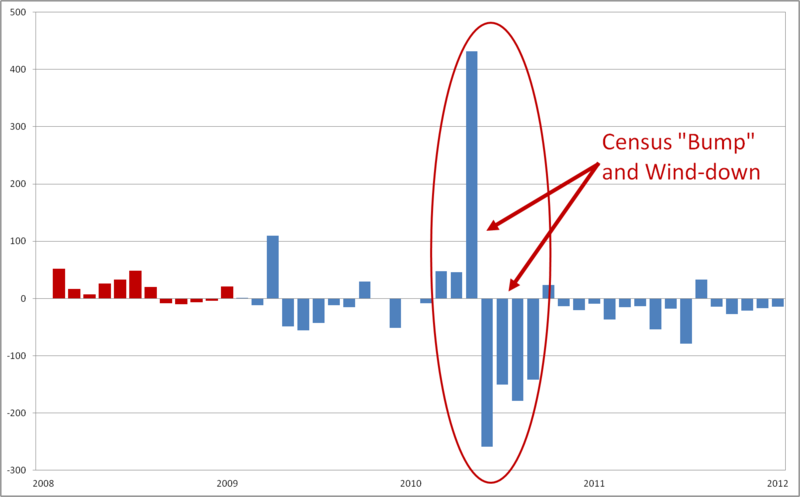
But I always wanted to see a chart which showed us what was happening in the public sector.

So I took matters into my own hands.  Here’s my own homemade chart showing jobs totals in the public sector since the beginning of the Great Recession:

JobsJanuary2012GovtCensus

As I plotted the data, I began to understand why Steve might not show the public-sector data each month: The one-time massive hiring bump (and susequent wind-down) surrounding the 2010 Census dwarfed all of the other changes in the chart, obscuring the other month-to-month changes.

As a result, the chart provided little insight into the fundamentals of public-sector jobs.

Fortunately, the Bureau of Labor Statistics published a press package which isolated hiring for the 2010 Census.  This allowed me to disentangle the one-time effects of the Census from the underlying fundamentals of public sector jobs.

The result is this chart showing monthly job totals in the public sector, excluding the volatile Census hiring data:

JobsJanuary2012GovtNoCensus

In many ways, this public sector chart is the inverse of the private sector one.

At the very moment when the private sector began to recover, at the very moment the economy needed to be firing on all cylinders, at the very moment the government should have leveraged negative real interest rates* to invest in jobs and infrastructure, one-sixth of the economy was (and continues to be) stuck in reverse.

And as austerity economics kicked in, the losses in the public-sector have only deepened, creating significant drag on the economic recovery.

Since Barack Obama took office three years ago, the public sector has shed some 603,000 jobs – averaging roughly 17,000 job losses per month.  (Compare that to the 840,000 public-sector jobs added during George W. Bush’s second term – an 18,000 per month clip.)

Without these public-sector job losses over the past three years, the unemployment rate would stand at 7.9% today instead of 8.3%.

While some might celebrate the wholesale destruction of government jobs, I don’t.

Public sector employees are vital to our economy and to my business.  Many of my customers are teachers, first responders, court personnel, and a wide array of other local and federal government employees. Public employees create better roads and safer neighborhoods and smarter students, all of which benefits my business.

The destruction of public sector jobs negatively affects my business and our economy.  As public sector employees lose their jobs, I lose business.  And the wider economy suffers, as well.

Austerity just doesn’t work.

::

* A bit of explanation here on “negative real interest rates”: instead of expecting a positive return on government bond investm0ents, investors are now willingly paying to have the federal government hold their money for 5, 7, and 10 years. In essence, investors from around the world will pay us to invest in our jobs and infrastructure – which would, in turn, pay even greater dividends to our economy as we emerge from recession.